17. Divergence, Curl and Potentials
a. The Divergence Operator
2. Geometric Interpretation of the Divergence
The divergence of a vector field is a measure of how much the vector field
is spreading out at each point. More concretely, if the vector field
\(\vec V\) is the velocity field of a fluid, then the divergence of the
velocity field, \(\vec\nabla\cdot\vec V\), measures of how much the fluid
is spreading out at each point. We will justify this in \(1\), \(2\) and \(3\)
dimensions.
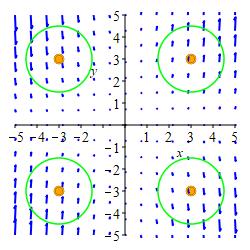
In the figures below, use your mouse to drag the center of the circle to
move it, or drag the circumference to change the radius.
1-dimension
Suppose the velocity field has only one component \(\vec V=\left\langle V_1 \right\rangle\). Then its divergence is \(\vec\nabla\cdot\vec V=\dfrac{dV_1}{dx}\). If the divergence is positive, then \(\dfrac{dV_1}{dx} > 0\) and \(V_1\) is getting larger as we move from left to right. So its plot looks like:
If we pick a point (Drag the green dot to \(x=2\).) and an interval centered at that point (say \((1,3)\)), we can see that the blue arrow going out of the interval (at \(3\)) is larger than the red arrow going into the interval (at \(1\)). So more fluid flows out of the interval than in. The fluid is diverging from that interval. Change the radius of the interval. (Drag the edge of the circle.) The fluid is expanding out of any interval around \(2\). So we say it is diverging at \(2\). Try changing the center and the radius. We see that for this vector field (which happens to be \(\vec V=\langle V_1\rangle=\langle x+2\rangle\)) the fluid is diverging at all points. (Its divergence is \(\vec\nabla\cdot\vec V=\dfrac{d(x+2)}{dx}=1\) at all points.)
If the divergence is negative, then \(\dfrac{dV_1}{dx} < 0\) and \(V_1\) is getting smaller (or more negative) as we move from left to right. So its plot looks like:
In each interval around each point, (Try changing the center and radius.) bigger arrows are going into the interval than out. The fluid is converging.
2-dimensions
Suppose the velocity field has two components \(\vec V=\left\langle V_1, V_2 \right\rangle\). Then its divergence is \(\vec\nabla\cdot\vec V=\dfrac{dV_1}{dx}+\dfrac{dV_2}{dy}\).
If both terms of the divergence are positive, i.e. \(\dfrac{dV_1}{dx} \gt 0\) and \(\dfrac{dV_2}{dy} \gt 0\), then \(V_1\) is getting larger as we move from left to right and \(V_2\) is getting larger as we move from bottom to top. So its plot looks something like the plot at the right. If we draw a circle centered at a point, (Drag the green dot to \((x,y)=(2,-3).\)) then there are bigger blue arrows pointing out at the right and bottom and smaller red arrows pointing in at the left and top. More fluid flows out of the circle than in. So the fluid is diverging or expanding. Try changing the radius (Drag the edge of the circle.) or moving the center. You can see this velocity field is diverging at all points.
If both terms of the divergence are negative, i.e. \(\dfrac{dV_1}{dx} \lt 0\) and \(\dfrac{dV_2}{dy} \lt 0\), then \(V_1\) is getting smaller (more negative) as we move from left to right and \(V_2\) is getting smaller (more negative) as we move from bottom to top. So its plot looks something like the plot at the right. If we draw a circle centered at a point, (Drag the green dot to \((x,y)=(-1,2).\)) then there are bigger red arrows pointing in at the left and top and smaller blue arrows pointing out at the right and bottom. More fluid flows into the circle than out. So the fluid is converging or contracting. Try changing the radius or moving the center. You can see this velocity field is converging at all points.
If the two terms have opposite signs but the sum is positive, then there are still bigger arrows pointing out than in and the fluid is diverging. If the sum is negative, then there are still bigger arrows pointing in than out and the fluid is converging.
3-dimensions
Suppose the velocity field has three components \(\vec V=\left\langle V_1, V_2, V_3 \right\rangle\). Then its divergence is \(\vec\nabla\cdot\vec V=\dfrac{dV_1}{dx}+\dfrac{dV_2}{dy}+\dfrac{dV_3}{dz}\).
If the divergence is positive at a point, then there are bigger arrows pointing out of a sphere centered at that point than into that sphere. More fluid flows out of the sphere than in. So the fluid is diverging or expanding.
If the divergence is negative at a point, then there are bigger arrows pointing into a sphere centered at that point than out of that sphere. More fluid flows into the sphere than out. So the fluid is converging or contracting.
Determine the regions in the plot where \(\vec\nabla\cdot\vec F \gt 0\) and where \(\vec\nabla\cdot\vec F \lt 0\).
Imagine drawing a small circle at each point. Are the arrows pointing into the circle bigger or smaller than those pointing out?
\(\vec\nabla\cdot\vec F \gt 0\) in the blue region, quadrants
I and IV.
\(\vec\nabla\cdot\vec F \lt 0\) in the red region, quadrants
II and III.
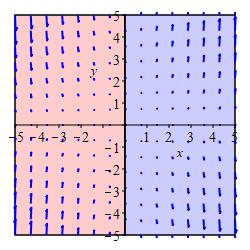
We draw circles at a bunch of points. Those centered in quadrants I and IV have bigger arrows pointing out than in. So \(\vec\nabla\cdot F \gt 0\) there. Those centered in quadrants II and III have bigger arrows pointing in than out. So \(\vec\nabla\cdot F \lt 0\) there. See the Answer for a summary plot.
Determine the regions in the plot where \(\vec\nabla\cdot\vec F \gt 0\) and where \(\vec\nabla\cdot\vec F \lt 0\).
Imagine drawing a small circle at each point. Are the arrows pointing into the circle bigger or smaller than those point out?
\(\vec\nabla\cdot\vec F \gt 0\) in the blue region, above
the diagonal.
\(\vec\nabla\cdot\vec F \lt 0\) in the red region, below
the diagonal.
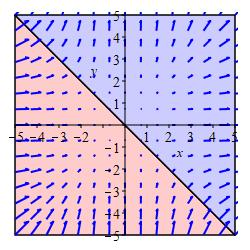
We draw circles at a bunch of points. Those centered along the line \(y=-x\) have as many big arrows going in as out. So \(\vec\nabla\cdot\vec F=0\) there. Those centered above and to the right of this line have bigger arrows pointing out than in. So \(\vec\nabla\cdot\vec F \gt 0\) there. Those centered below and to the left of this line have bigger arrows pointing in than out. So \(\vec\nabla\cdot\vec F \lt 0\) there. See the Answer for a summary plot.
s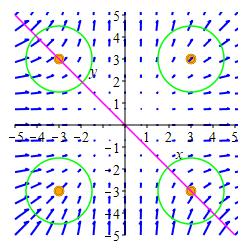
A fuller geometrical discussion of the divergence uses an integral to sum up the arrows going in or out over the boundary circle (or sphere) and takes the limit as the radius goes to \(0\). This discussion appears in the chapter on the Interpretation of Divergence and Curl.
Heading
Placeholder text: Lorem ipsum Lorem ipsum Lorem ipsum Lorem ipsum Lorem ipsum Lorem ipsum Lorem ipsum Lorem ipsum Lorem ipsum Lorem ipsum Lorem ipsum Lorem ipsum Lorem ipsum Lorem ipsum Lorem ipsum Lorem ipsum Lorem ipsum Lorem ipsum Lorem ipsum Lorem ipsum Lorem ipsum Lorem ipsum Lorem ipsum Lorem ipsum Lorem ipsum